
Machine Learning Fairness and the Measures Needed to Prevent AI Bias?
Machine Learning Fairness and the Measures Needed to Prevent AI Bias
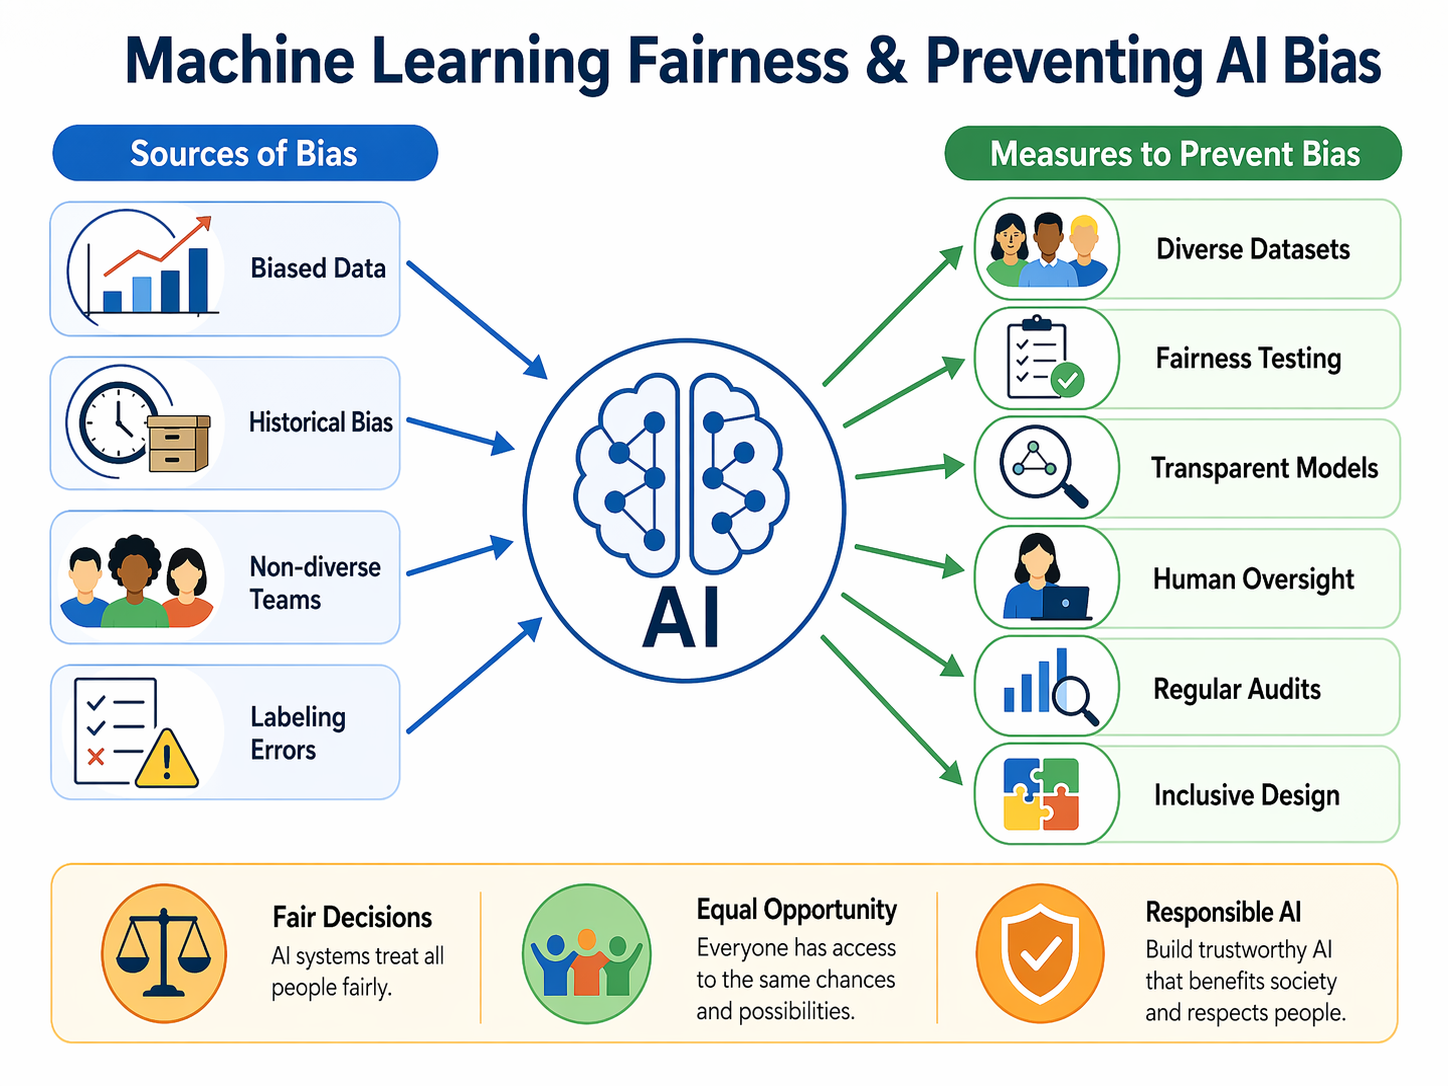
“Fairness” in machine learning (ML) means that a model’s errors and decisions do not systematically disadvantage people because of protected attributes such as gender, caste, or location. In practice, this is tested with fairness criteria. For example, demographic parity looks at whether positive rates are similar across groups, while equalized odds checks whether false-positive and false-negative rates are similar across groups. These criteria remind us that accuracy alone can hide harm when one group bears more errors than another.
India’s school data shows why fairness is not an abstract issue. Consider a common “area bias” pitfall: if a dataset draws heavily from blocks where girls are scarcely present in secondary classrooms, a naïve model might “learn” that girls are weak at mathematics simply because there are too few observations, not because of ability. Statewide figures already rebut such stereotypes. The official UDISE+ 2021–22 tables report Haryana’s Gender Parity Index (GPI) for gross enrolment at secondary as 0.97 and at higher secondary as 1.01, meaning near parity or better.
Learning outcomes data also complicate easy narratives. ASER 2023, which studies rural youth aged 14–18, finds girls slightly ahead in basic reading, with 76% of females compared with 71% of males able to read at least Grade 2 text. Boys, however, hold a small edge on a division task, with 45% of males compared with 42% of females answering correctly. Beyond classroom basics, the digital gap is starker. Among youth who can use a smartphone, 44% of males have one of their own versus only 20% of females, and males perform better on phone-based tasks such as using maps, at 49% versus 25%. If an admissions or scholarship model uses digital behaviour as a proxy for “readiness,” it can systematically underrate girls.
Recent board results also show how misleading blanket claims about girls “not doing math” can be. In Haryana’s 2025 Class X exams, girls outperformed boys on overall pass rate, with 94.06% compared with 91.07%. While pass rates are not subject-specific, they still show that stereotypes do not match performance data.
What Should Schools, Ed-Techs, and Testing Platforms Do?
Collect and audit representative data, disaggregated by gender and geography. Before modelling, institutions should compute coverage and outcome tables by district or block and by gender, including intersections of these categories. “Thin” cells, such as secondary-level girls in a specific block, should be flagged and corrected through targeted data collection or reweighting so the model does not learn from absence. Documented pipelines such as Datasheets for Datasets can help record who is, and is not, represented in the data.
Build with fairness constraints and measure trade-offs. During training or post-processing, developers should enforce metrics such as equalized odds or demographic parity and report group-wise error rates. They should also be transparent about trade-offs between overall accuracy and group equity. Research in health and education modelling shows that this can be done rigorously.
Document model limits for decision-makers. Schools and platforms should publish Model Cards that clearly state intended use, evaluation by subgroup such as gender × area, and important restrictions. For instance, a model should not infer mathematical potential from digital-usage traces alone.
Test individual-level fairness with causal tools. Where sensitive attributes may have influenced historic labels, such as teacher recommendations, developers should probe counterfactual fairness. In other words, they should ask whether the prediction would change if the same student were counterfactually male or female, while all other meaningful factors remained the same.
Conclusion
Fairness is not a luxury add-on. In India’s schools, where enrolment parity is increasingly within reach but digital access and task exposure still differ by gender and geography, fair ML demands better data, transparent documentation, and continuous auditing. These steps may not make selection systems perfect, but they can stop algorithms from quietly hard-coding yesterday’s inequalities into tomorrow’s opportunities.
References
ASER Centre. (2024). ASER 2023: Key findings (Age 14–18, rural). https://asercentre.org/
Gebru, T., Morgenstern, J., Vecchione, B., Vaughan, J. W., Wallach, H., Daumé III, H., & Crawford, K. (2018). Datasheets for datasets. arXiv preprint arXiv:1803.09010.
Hellman, D. (2025). Algorithmic fairness. In Stanford Encyclopedia of Philosophy.
Massachusetts Institute of Technology. (2020). Fairness criteria (Demographic parity, equalized odds). MIT OpenCourseWare.
Ministry of Education, Government of India. (2022). UDISE+ 2021–22 report. https://www.education.gov.in/
Mitchell, M., Wu, S., Zaldivar, A., Barnes, P., Vasserman, L., Hutchinson, B., … Gebru, T. (2019). Model cards for model reporting. Proceedings of FAT*, 220–229.
Das, U. (2023). Solving it correctly: Prevalence and persistence of gender gap in mathematics learning outcomes among rural Indian children. International Journal of Educational Development.
Times of India. (2025, May). Haryana girls outshine boys in HBSE Class X result.